
How Many Dollars Of Debt Is Necessary To Produce A Dollar Of GDP? It’s Not Good.
Submitted by Chris Hamilton via Econimica blog,
GDP Without the Debt Incurred Is Just A Gross Distortion
GDP or gross domestic product is the big lie used by politicians because it neatly avoids the debt undertaken to achieve it’s purported growth. The chart below shows annual US GDP growth back to 1980.
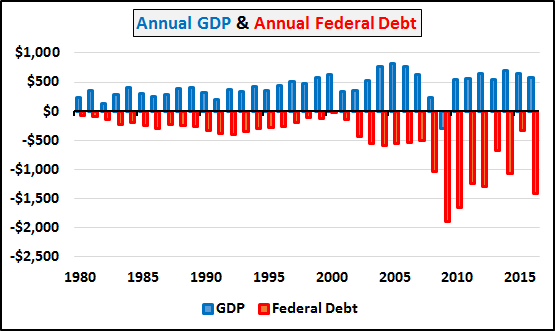
However, the chart below shows both sides of the equation…the annual GDP growth and the annual federal debt incurred, spent, and (thus counted as part of the growth) to achieve the purported growth.
Below, annual GDP minus the annual growth in federal debt to achieve that “GDP growth”. The last eight years were abysmal and 2016 the third worst year in history (this even assumes Q4 GDP comes in at a relatively strong 2.5%). This trend ain’t yer friend.
Over the last eight years, the Obama economy (as measured by GDP) grew $3.9 trillion and federal debt grew by $9.6 trillion…said otherwise, GDP contracted $5.7 trillion when all the new debt is subtracted. Essentially, America is a nation of renters that never intend to pay off our national debt but pay perpetual rent on this debt. Unfortunately the rent will only keep going up so long as debt grows significantly faster than the economy that is the basis of tax collection.
Trump’s Plan
Trump’s big plan is to spend more and tax less…aka run YUUUGE(er) deficits building new and rebuilding existing infrastructure with the intent of goosing economic activity or GDP (also known as Japan’s plan for the last two decades) while collapsing tax rates and tax revenue (at least in the “short” term). Perhaps Donald will push to repatriate those trillions of US corporate dollars, currently sitting abroad, at little to zero tax rates? Further, Donald wants to brand China a currency manipulator and cripple China’s export machine…but China (and Russia) appear to be getting a head start on the president elect by dumping US debt.
In fact Donald, we have a big problem. According to the Treasury’s TIC data, on a net basis nobody is buying our debt anymore…but us. Not the Fed (at least officially), not foreigners, and the Intragovernmental buying is fast declining (due to declining excess social security funds, etc.). That leaves just US based institutional buyers (banks, pension funds, insurers, corporations) and the odd patriotic private citizen to buy up all that new and rollover debt. This means a trillion+ dollars a year will go into buying low yielding Treasury debt rather than into equities or research or capital expenditures or or or.
If GDP grows by a half trillion annually but it takes twice as much annually, or one trillion, to buy up the new Treasury debt (new plus rollover debt)…what the hell are we talking about??? The amount of money moving in the economy would continue collapsing? So, below is a quick review that foreigners (with dollar surplus’), nor the Fed, nor a fading Social Security surplus are recycling dollars back into US Treasury’s.
Who Owns America’s Debt…& Who’s Going to Keep Buying It
The chart below outlines who has owned America’s Treasury debt, by period, from 2001 until present (November, 2016). The largest holder of US debt are foreigners, followed by the US public (again…comprised of US based insurers, pensions, banks, and private citizens), the Social Security driven Intragovernmental holdings, and finally the Federal Reserve.
Below, the total net issuance, by period, and who purchased the Treasury debt during each period. The massive surge in new debt from ’08 through ’14 was primarily purchased by foreigners and the Federal Reserve.
However, in the above, you may notice the since the Fed ceased QE at year end 2014, foreigners have entirely ceased buying US Treasury debt and indeed have been net selling despite surging Treasury issuance.
Below, total foreign purchasing, per period and by whom…first the BRICS ceased buying as of 2011 (China poured 50% of it’s trade dollar trade surplus into Treasury’s from 2000 until July 2011…the debt ceiling debate…and China hasn’t purchased a single net new Treasury since). The China and BRICS cease in buying was offset by a surge form the BLICS nations (Belgium, Luxembourg, Ireland, Cayman Islands, Switzerland). But since the end of QE…foreigners have no interest in buying the surging stock of US debt.
Below, what this purchasing looks like as a percentage of total debt issued by the Treasury.
Lastly, if we focus solely on who purchased the marketable debt as a percentage, by period…we realize there is no buyer but us Americans supposedly recycling trillions in still near record low yielding debt.
Finally, the Donald driven surge in new issuance must be purchased by primary dealers. However what happens in the secondary market with the continuing abandonment of foreign holdings (and Fed normalization…lol) should be of YUUGE concern. In short, absent foreigners, Intragovernmental surplus’, or pure Fed monetization, either the US Public will go bankrupt buying this low yielding debt or the rates will rise and the US government will essentially go bankrupt printing currency (new debt) solely to pay old debt.
Why Regardless Clinton or Trump, The next 8 Years Will Be The Worst Economic Period In US History
Regardless who was chosen as president for the next two terms, 80% of the population growth in the US will come from 65+yr/olds. This is the inverse from Bill Clinton’s presidency which was the benefactor of the strongest demographic and population changes with 85% of the growth coming from the working age population. In short, as population growth among the young peaked in the 80’s, (and has slowed to a crawl), the Fed has been dropping rates all along to incent the decelerating growth among the young to spend more…but the population growth to consume(r) our way out of this debt bubble is never coming.
Below, the reversing make-up of population growth from the peak under Clinton to the upcoming bottom under President Trump (particularly in the second term). And all these numbers assume continued current levels of immigration…if that slows (or a Trump deportation occurs), the numbers of young will be even further reduced.
Below (focusing on the 0-4yr/old US population headwaters) what the Census Bureau’s ’08 estimate looked like, what the current ’14 estimate looks like, and what the likely ’16 revision to population growth should look like based on all incoming data. And these massive downgrades since 2008 to population growth absolutely undercut present and future demand.
This isn’t a blip or “transitory” change but likely a half century or more secular shift. And to be clear, economic growth is all about a growing consumer base…it doesn’t matter if you have 327 million or 7.3 billion in total…growth is only determined by the change in consumers annually and their ability to consume (income/savings/access to credit). When this population growth numerator begins declining (essentially now)…the growth equation (and support of the existing system leverage) fails.
What About the Big World Beyond America?
Unfortunately (fortunately?) for the US, the advanced and developing world are much worse off (below). The peak growth in the annual combined working age population (15-64yr/olds) among the 35 wealthy OECD nations, China, Brazil, and Russia has collapsed since its 1981 peak. The annual growth in the working age population among these nations has fallen from +29 million a year to just +1 million in 2016…but from here on, the working age population will be declining every year. Declining buyers vs. surging sellers among these nations are plain to see ever since. These nations make up almost 3/4’s of all global demand for oil and exports in general. Their combined working age populations will shrink every year from here on (surely for decades and perhaps far longer). Global demand for nearly everything is set to suffer.
Still not convinced? The chart below shows what world population looks like with Africa removed (or ex-Africa) according to the UN! The global population of under 45yr/olds that matter economically (and are capable of child birth) have peaked. And global demand has peaked with them. Nearly all ex-Africa population growth from here forward is the 45+yr/old population living far longer (particularly among the 65+yr/old population).
Conclusion
America and the globe face an imminent collapse in demand that even central banks, NIRP, monetization schemes, tax cuts nor infrastructure spending won’t likely be able to paper over any longer (but not before they literally try everything and anything in quick cascading fashion). A systemic collapse is likely dead ahead…and I’m quite sure Hillary would have done nothing but pour gasoline on the fire…and this seems true for Trump as well. America and the globe need a restructuring (also known as a bankruptcy) and Trump is honestly the king of bankruptcy…perhaps he’ll take the highly unpopular action and do what he’s actually good at…and use a bankruptcy to reset and restore balance to the system (but I won’t hold my breath).
If I’ve got the plan (or lack there-of) right, then right now is a very good time to rethink this one??? If you are curious why all this is happening, it is outlined domestically HERE and globally HERE or HERE.